Qualitative Analysis Methodology
Qualitative Survey Data
6,686 survey respondents (46%) provided comments across three main open-ended questions on the IDEAL DEI Survey, totaling more than 680,000 words of text. Due to the volume of survey comments and the need to ensure respondent privacy, the IDEAL Survey team engaged an external research firm, Actionable Insights (AI), to analyze the qualitative data. The IDEAL DEI Survey team provided the survey comments to the research firm, removing any additional identifying survey data. The firm reviewed the text and identified a taxonomy of themes across the content.
The qualitative data analyzed came from three questions at the end of the survey:
- If you would like to tell us more, please tell us about your experiences and perspectives on these and other issues that are important to you.
- We would also like to know what is working well at Stanford. What efforts, initiatives, or policies have you seen, experienced, or participated in that have had a positive impact on improving diversity, equity, and inclusion at Stanford?
- What else would you like to tell us?
Analysis Methods
Qualitative research is a form of social science research that involves the collection, analysis, and interpretation of non-numeric data; in this case, narrative answers to survey questions. Other forms of qualitative data collection might include participant observation, focus groups or interviews, photography, or the gathering of existing documents and texts. Qualitative analysis is generally inductive; researchers develop concepts based on the data that have been gathered and categorize the data into patterns or “themes.” One of the main goals of qualitative research is to describe and better understand complex phenomena, such as individual behaviors, experiences, and perceptions. Qualitative data are not intended to be quantified or otherwise measured in the same way that statistical data are. Similarly, because qualitative data are contextually based, the results are not intended to be generalizable in the same way that the results of quantitative research are (Actionable Insights).
The IDEAL team provided a spreadsheet with simple demographics (role, gender, and race/ethnicity) and qualitative survey responses to AI’s coding team. AI’s team stratified the survey responses by role (undergraduates, graduate students, postdocs, staff, and faculty) and read 2% of the responses from each role-group. Based on this initial read, AI inductively developed a preliminary codebook and provided it to the IDEAL team. Several members of the IDEAL team reviewed the codebook and provided feedback, which AI used to refine the set of codes it used for the project.
The coding team then used NVivo software to code and analyze the data. AI’s team conducted two rounds of coding, representing another 1% of the dataset, and scored each round for interrater reliability. By the end of the second round, the coders were in substantial agreement. The codebook continued to evolve throughout these rounds of coding. Three coders then each deductively coded separate portions of the dataset, representing the remainder of the qualitative data. Coders met weekly to review and maintain alignment with each other and the codebook. Once the dataset was fully coded, the research team analyzed the data, checking in with each coder regarding sense-making of themes, and produced a final report detailing the major themes that emerged as well as a coded dataset to be used for further analysis.
Quotes Selection Process
In the qualitative findings, how were the quotes selected?
In summarizing the key findings that emerged from survey comments, we use respondents’ own words to illustrate broader themes. After the research firm analyzed the comments for thematic content, the IDEAL Survey team worked with the research firm to select a sample of comments that were representative of each theme. The quotes provided in pages that follow should be viewed as representative of many other very similar comments.
The quotes selected for this report:
- Relate personal, lived experiences of individuals in the Stanford community
- Illustrate how race, ethnicity, and other identities can influence interactions, behaviors, and opinions at Stanford
- Are drawn from all roles at the University represented in the survey data: students, faculty, post-docs, and staff
- Illustrate the main topics within a relevant theme as well as variation across comments within a theme
Note: The comments represent a sample of survey respondents’ experiences. No single comment should be viewed as representative of the experiences of all members of an identity or group at Stanford, nor are the themes and individual quotes presented necessarily generalizable to Stanford community members who did not take the survey.
Representativeness
How representative are the [findings, quotes] of all [survey takers, the Stanford community]?
The 6,686 respondents to the open-ended questions were demographically similar to the 14,907 survey respondents overall. White, woman, and/or native English speakers were slightly over-represented in the survey comments, compared to the overall number that completed the survey. Asian/Asian American respondents and respondents who identified as a man were slightly under-represented in the survey comments compared to the overall number that completed the survey.
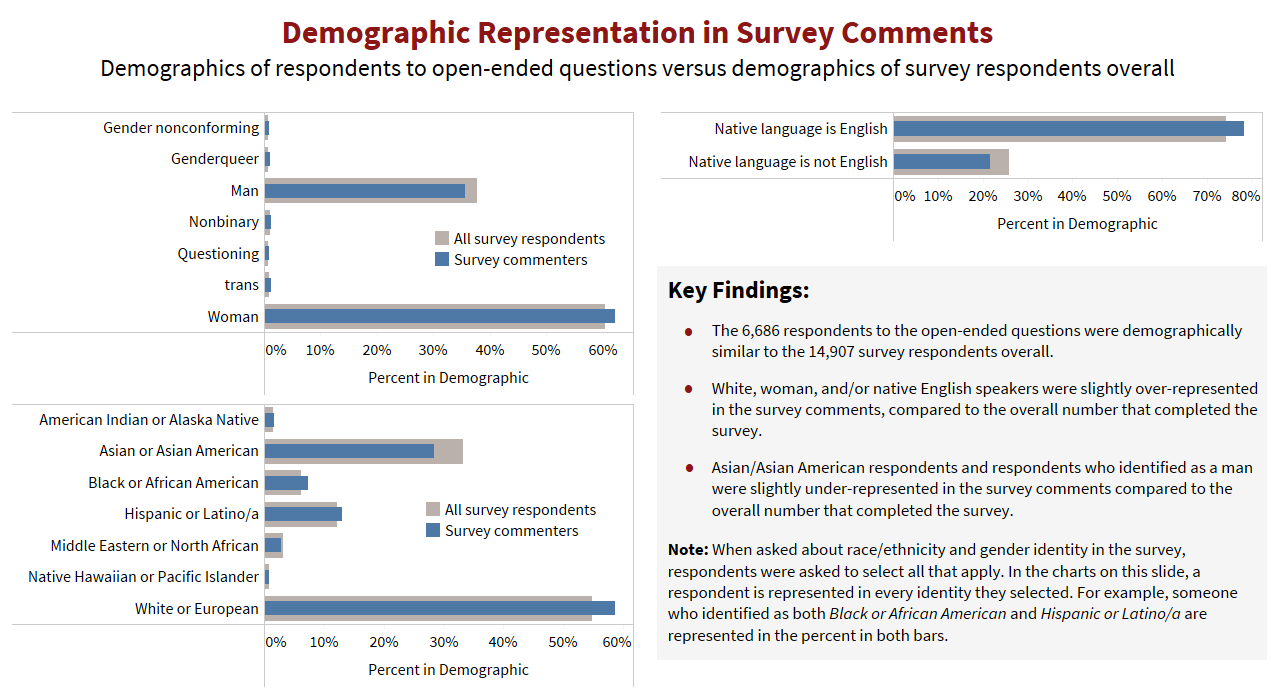
Note: When asked about race/ethnicity and gender identity in the survey, respondents were asked to select all that apply. In the charts on this slide, a respondent is represented in every identity they selected. For example, someone who identified as both Black or African American and Hispanic or Latino/a are represented in the percent in both bars.