Clinician Educators
Survey Administration
In May 2021 an email invitation was sent out to 1,636 Stanford clinician educators, inviting them to participate in the IDEAL DEI survey. By the time the survey closed in June, 478 clinician educators (29%) had completed the survey.
Demographics of Respondents
A primary purpose of the IDEAL DEI survey was to collect new and more detailed information about who we are as a community. Below are several examples of new information about the demographics and identities represented among the clinician educators who responded to the survey. We encourage you to explore the survey data further in the IDEAL Survey Demographics Dashboards. You can also find information for the full clinician educator population on the IDEAL Dashboard, which displays diversity data from university records (and does not incorporate data from this survey).
Racial or Ethnic Identity
This survey approached collecting racial or ethnic identity information differently than the federal race and ethnicity categories used in the IDEAL dashboards and other university reporting. For example, the survey added the category of Middle Eastern or North African to the racial and ethnic identity categories respondents could select. In addition to providing one or more broad categories, the survey prompted respondents to write in as much specific detail as they desired regarding their racial or ethnic identities. The survey also asked respondents to provide information about their country of origin and religious identity.
Overall, 94% of clinician educators selected a single racial or ethnic identity category on the survey; 83% identified as White or European and/or Asian or Asian American. When asked to describe their identity in additional detail, clinician educators provided over 100 unique sub-categories to further describe their racial or ethnic identity. For example, of the 40% of clinician educators survey respondents who selected Asian or Asian American as one of their racial or ethnic identities, respondents provided 24 unique specific racial or ethnic identifiers (e.g., Chinese, Indian, Korean, etc.) to describe their Asian or Asian American ethnicity.
Gender and Sexual Identity
With regard to sexual identity, 8% of clinician educators identified as something other than heterosexual or straight. Examining the intersection of gender and sexual identities, 10% of clinician educator survey respondents selected one or more identities included under the LGBTQ+ umbrella; that is, identifying as something other than a heterosexual or straight man or woman.
Additional Demographics
On the IDEAL Survey data dashboards, you can view additional demographic and identity characteristics of survey respondents, and their intersections, including:
- Religious or spiritual identity
- Politics
- Country of origin
- Disabilities
- Self-identified as coming from a low income background
For example, 16% of clinician educator survey respondents identified as coming from a low income background, while 9% are from families where no parent or guardian achieved a 4 year college degree or higher.
Inclusion and Sense of Belonging at Stanford
The survey covered several different aspects that might contribute to a respondent’s overall experience of inclusion or sense of belonging at Stanford
- feeling valued
- finding groups, communities or spaces of inclusion or exclusion
- general aspects of psychological safety while participating in day-to-day activities associated with a respondent’s role at Stanford
Feeling Valued
Overall, 61% of all clinician educator survey respondents agreed that they “felt valued as an individual at Stanford,” and 77% said they felt valued in their department or work unit. However, 46% of clinician educators who identified as coming from a low-income background agreed with feeling valued as an individual at Stanford.
Inclusion and Exclusion
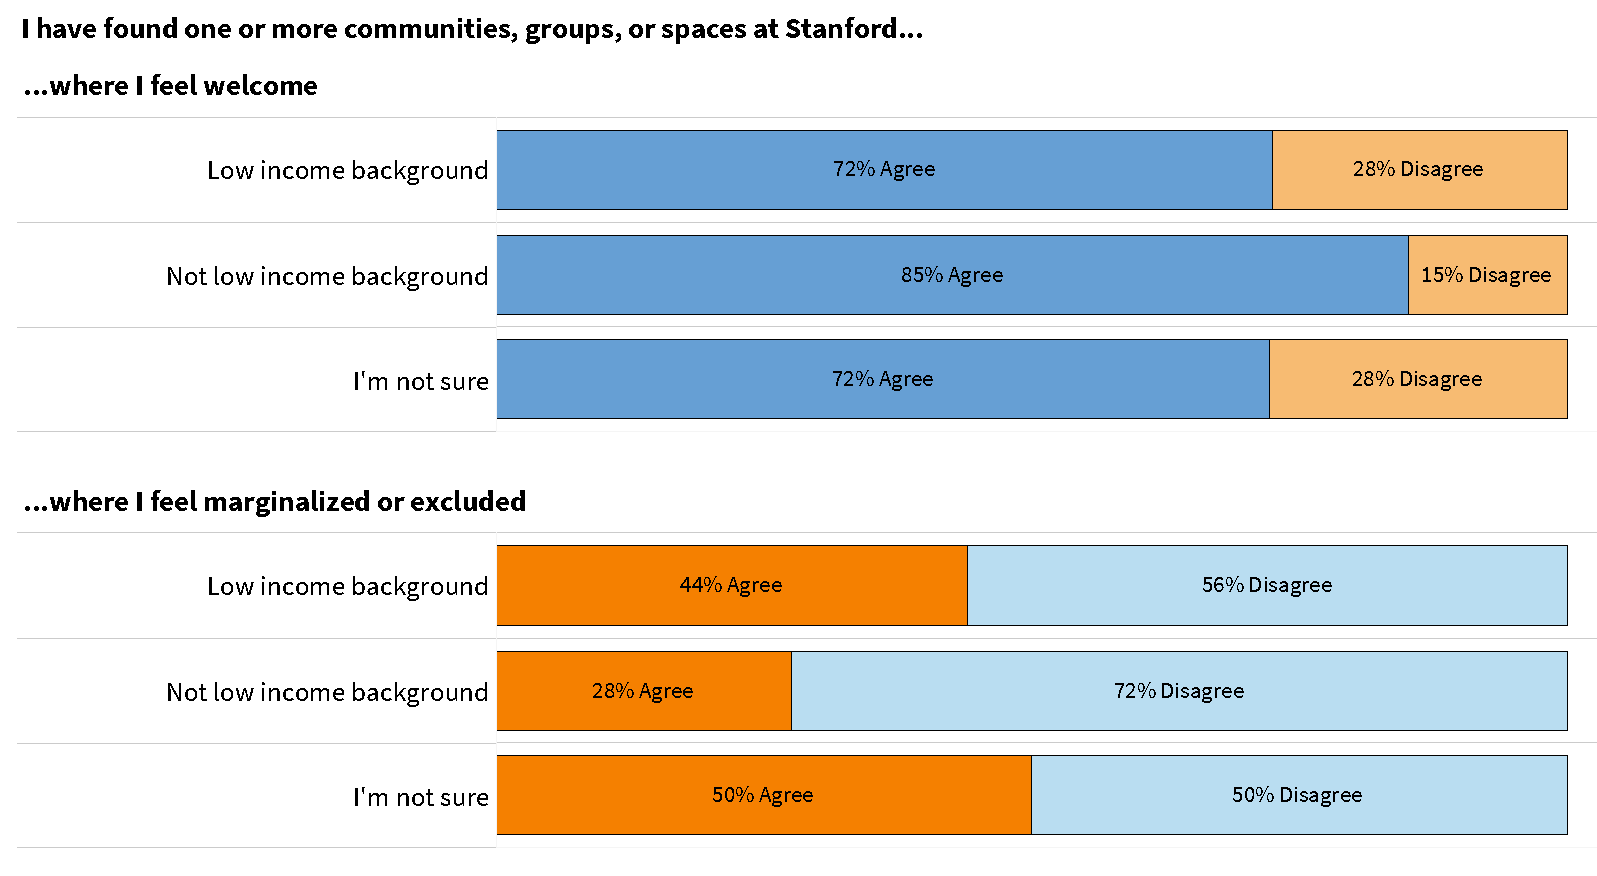
On average, 83% of clinician educator respondents reported having found a community, group, or space at Stanford where they felt welcome. The proportion of clinician educators that indicated finding a welcoming, inclusive space at Stanford varied across demographics and backgrounds.
- 72% of clinician educators who identified as coming from a low-income background reported they had found a community, group or space at Stanford where they felt welcome.
- 68% of clinician educator survey respondents who identified as not from the U.S. reported they had found a community, group or space at Stanford where they felt welcome.
While 83% of clinician educators found at least one welcoming space at Stanford, 31% of clinician educators indicated at least one place where they felt marginalized or excluded; this proportion varied across demographic identities.
- 64% of Black or African American clinician educators indicated places where they felt marginalized or excluded.
- 44% of clinician educators who identified as coming from a low-income background encountered places where they felt marginalized or excluded.
Psychological Safety
(Psychological safety definition may be found on the Definitions page)
The survey asked a set of questions to gauge clinician educators’ feelings of respect and safety in their work units at Stanford. One question, in particular, asked respondents to rate their agreement with the following statement: “Members of my unit value and respect each other’s contributions.” Overall, 81% of clinician educators agreed with this statement. However, 60% of clinician educator respondents who identified as Black or African American agreed with this statement.
You can explore these findings in the Inclusion and Belonging dashboards.
Experience with Microaggression, Discriminatory, and Harassing Behaviors
The survey asked about individuals' experiences with microaggression, discriminatory, and harassing behaviors. (You can find out more about how the survey asked about these experiences in the FAQ document). Overall, 46% of clinician educators indicated that they had experienced at least one of these behaviors within the last two years.
Before further discussing the prevalence of these experiences, it is important to highlight the impact that that these harmful behaviors had on clinician educator survey respondents:
- 83% of clinician educators who experienced at least one instance of microaggression, discriminatory, verbal or physical harassing behaviors indicated at least one impact associated with their experiences.
- 32% of clinician educators who experienced microaggression, 64% who experienced verbal harassing behaviors, and 41% who experienced at least one discriminatory behavior felt their experiences “created an intimidating, hostile, or offensive social, academic, or work environment.”
- Subsequent to their experiences, about 29% “seriously considered leaving Stanford,” 28% “avoided departmental or professional events,” and 28% “felt uncomfortable voicing their opinion.”
Microaggressions
“Microaggression” is used as a term for commonplace daily verbal, behavioral or environmental slights, whether intentional or unintentional, that communicate hostile, derogatory, or negative attitudes toward stigmatized or culturally marginalized groups (Sue 2010). Racial microaggressions are “brief, everyday exchanges that send denigrating messages to people of color because they belong to a racial minority group”(Sue et al 2007).
The word “microaggression” itself never appeared on the survey. Rather, respondents were asked whether they experienced specific types of behaviors during the last two years by someone associated with Stanford:
- Someone invalidated your lived experience due to your racial or ethnic identity,
- Someone assumed you were inferior due to your racial or ethnic identity,
- Someone acted as if they were afraid or wary of you due to your racial or ethnic identity,
- Someone made you feel othered or exoticized due to your racial or ethnic identity.
Each of these questions also listed several concrete examples of these behaviors. In this report we use the collective term microaggression to describe any of these experienced behaviors.
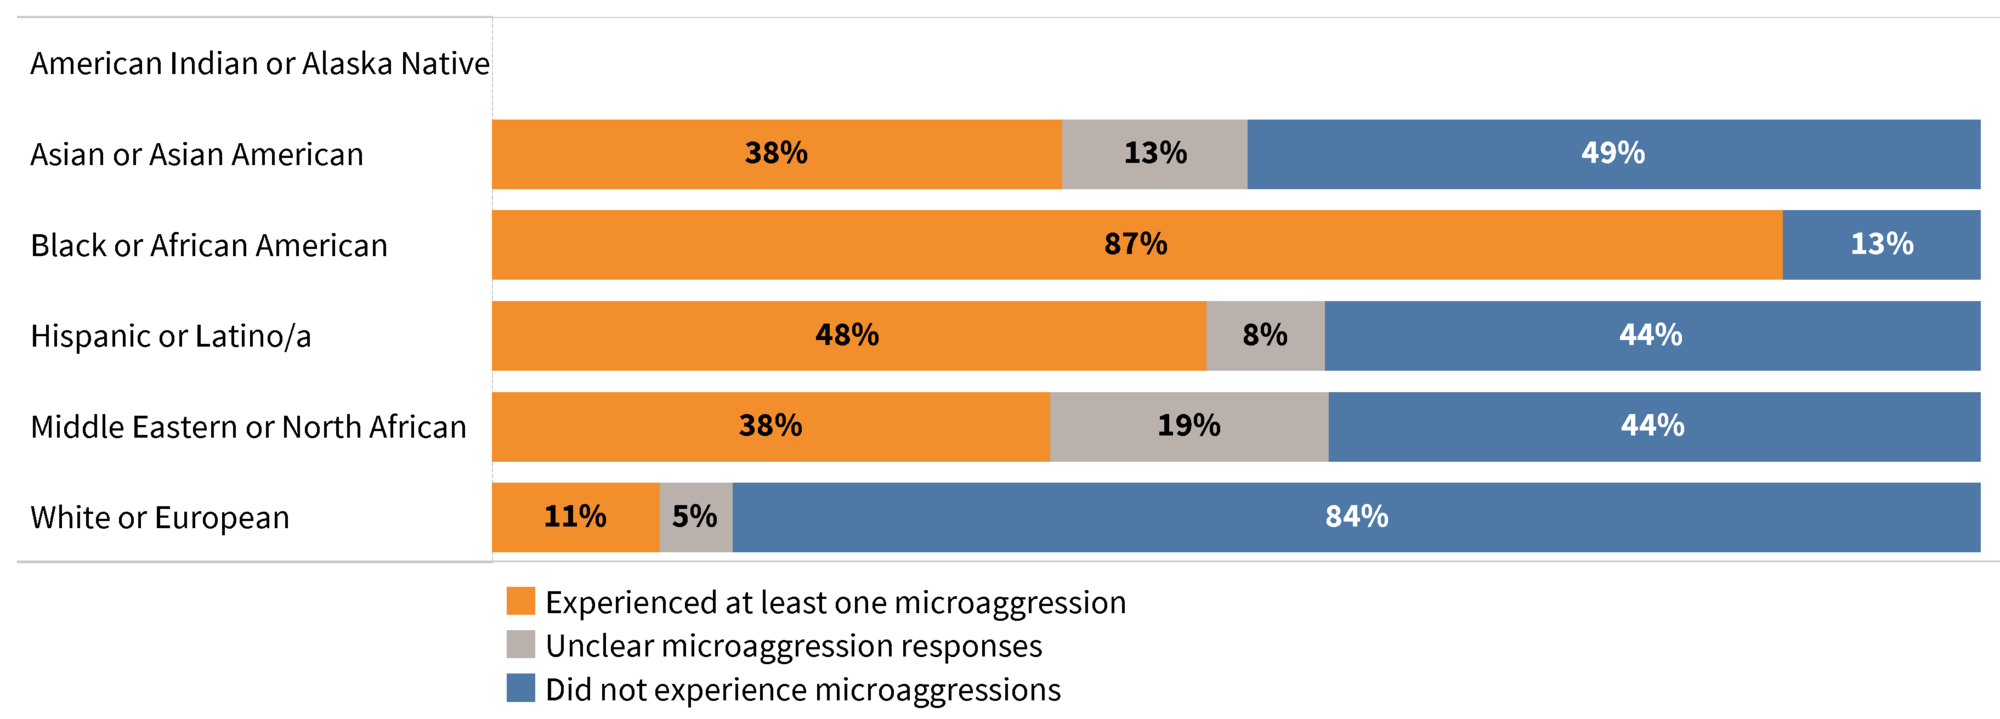
The percent of clinician educator survey respondents that indicated they experienced microaggressions ranged widely across demographic groups - particularly by racial or ethnic identity. Eighty-seven percent (87%) of clinician educators who identified as Black or African American experienced at least one form of microaggression over the past two years. This proportion is higher than for respondents identifying with other racial or ethnic identities (Note: this is based on a small number of respondents; N=15).
When asked about their relationship to the perpetrators of these microaggressions, 56% of clinician educator survey respondents indicated that their coworker or colleague was a perpetrator and 36% indicated that it was a client, patient, or customer.
Discriminatory Behaviors
(Discriminatory behaviors definition may be found on the Definitions page)
Survey respondents were directly asked, during the last two years, “have you ever experienced discriminatory behaviors by someone associated with Stanford?” For example:
- Graded unfairly by a professor or instructor,
- Discouraged from pursuing a particular major,
- Denied or overlooked for a mentorship opportunity,
- Denied necessary accommodations.”
Overall, 17% of clinician educators indicated that they had experienced discriminatory behaviors by someone associated with Stanford. Twenty five percent (25%) of clinician educators who identified as coming from a low-income background experienced discriminatory behaviors by someone associated with Stanford.
If a respondent indicated having experienced discriminatory behaviors, they were then presented with the following text:
Of the 75 respondents who experienced discriminatory behaviors, 25% indicated they felt the experiences were due to their racial or ethnic identity. Of the clinician educators who believed their experience of discriminatory behavior was due to their racial or ethnic identity, the most common behaviors indicated were:
- “denied or overlooked for a leadership opportunity” (47%)
- “denied or overlooked for professional development or mentorship opportunities.” (47%)
Verbal, Written, or Online Harassing Behaviors
Survey respondents were asked:
During the last two years you have been employed at Stanford (or fewer, depending on when you were hired), have you ever experienced verbal, written, or online harassing behaviors by someone associated with Stanford? For example:
- Someone made a derogatory remark or gesture in person or online
- Someone sent me a derogatory email, text, or social media post
- Someone defaced property with derogatory graffiti
- I was embarrassed, humiliated, or threatened by someone in person or online
Overall, 26% of clinician educator respondents indicated having experienced verbal, written, or online harassing behaviors within the past two years.
- 28% of clinician educators who identified as a woman experienced verbal harassing behaviors, compared to 20% of respondents who identified as a man.
- 41% of clinician educators who identified as coming from a low-income background experienced verbal harassing behaviors
- 32% of clinician educators who identified as not being from the U.S. experienced verbal harassing behaviors.
When asked about their relationship to the perpetrators of these verbal harassing behaviors, 52% of clinician educator survey respondents indicated that their coworker or colleague was a perpetrator, 36% indicated that their boss or supervisor was a perpetrator, and 32% indicated that it was a client, patient, or customer.
Physical Harassing Behaviors
The survey question asking about physical harassing behaviors listed as examples:
- “I was threatened with physical violence”
- “I experienced physical violence”
- “Someone tried to touch me without my consent”
- “I was touched in a way that I did not want”
Overall, 14 clinician educator respondents indicated they experienced physical harassing behaviors by someone associated with Stanford within the past two years.
Impacts of These Experiences Among Clinician Educators
When reflecting on the totality of their experiences, the most commonly indicated impacts among clinician educator survey respondents who experienced at least one of the behaviors described above included:
- “seriously considered leaving Stanford” (29%),
- “avoided departmental or professional events” (28%), and
- “feeling uncomfortable voicing their opinion” (28%).
When asked about the impacts directly associated with each of the four experiences surveyed:
- Of clinician educators who experienced microaggressions, approximately 65% indicated that they experienced some sort of significant impact as result of these behaviors. The most commonly cited impact was “created an intimidating, hostile, or offensive social, academic, or work environment.”
- Of clinician educators who experienced discriminatory behaviors, approximately 90% indicated that they experienced some sort of significant impact as result of these behaviors. The most commonly cited impact was “interfered with your academic or professional performance” (56%)
- Of clinician educators who experienced verbal harassing behaviors, approximately 90% indicated that they experienced some sort of significant impact as result of these behaviors. The most commonly cited impact was a “created an intimidating, hostile, or offensive social, academic, or work environment.” (64%).
For More Information
We encourage you to explore the survey findings by viewing dashboards on:
References
Sue, D. W. (2010). Microaggressions in Everyday Life: Race, Gender, and Sexual Orientation. Wiley. pp. xvi. ISBN 978-0-470-49140-9.
Sue, D. W., Capodilupo, C. M., Torino, G. C., Bucceri, J. M., Holder, A., Nadal, K. L., & Esquilin, M. (2007). Racial microaggressions in everyday life: implications for clinical practice. American psychologist, 62(4), 271.